Where to Find Professional Looker Report Templates and Examples That Actually Work
The landscape of marketing analytics has matured significantly. Just a few years ago, a "good" dashboard was simply one that successfully connected to Google Analytics and displayed a few bar charts. Today, as of 2026, the expectations for data visualization have shifted dramatically. Agencies and in-house teams are no longer looking for basic descriptive charts; they require automated decision-support systems that blend multiple data sources, calculate complex metrics like true Customer Acquisition Cost (CAC), and provide actionable insights at a glance.
However, this evolution has introduced a severe technical hurdle. As dashboards become more complex, they demand more data processing power. Many users who download free, visually appealing templates from community forums quickly discover a harsh reality: the reports look fantastic with sample data, but they break entirely when connected to live, high-traffic client accounts. This article serves as a comprehensive catalog and technical guide to finding, evaluating, and deploying professional Looker Studio (formerly Google Data Studio) templates that are engineered to withstand the rigors of real-world agency use.
Why Most Looker Studio Dashboards Fail During Client Presentations
There is a well-known scenario in the marketing agency world often referred to as the "Tuesday 10 AM Failure." An analyst spends hours over the weekend meticulously designing a beautiful Looker Studio report. They test it on Monday, and everything loads perfectly. But on Tuesday morning, during a live screen-share presentation with a major client, the dashboard suddenly displays a screen full of gray boxes bearing the dreaded message: "Looker Studio cannot connect to your dataset. Quota Exceeded."
This failure is not a bug; it is a feature of how Google Analytics 4 (GA4) manages data requests. To understand why professional templates are necessary, one must understand the GA4 API Quota system. Google enforces strict limits on how much data can be pulled from a GA4 property via the API within a specific timeframe. The standard limit is 1,250 "tokens" per hour per property.
When a user opens a Looker Studio report, every single chart, scorecard, and table sends a separate query to the GA4 API, consuming tokens. If a dashboard has 15 charts, and three people (the account manager, the client, and the analyst) open the report simultaneously, the API receives 45 simultaneous queries. Complex charts that filter multiple dimensions consume more tokens. In many cases, a standard, unoptimized template will burn through the 1,250-token limit in less than five minutes.
According to recent industry analysis, an estimated 73% of standard Looker Studio dashboards fail within 48 hours of deployment if they rely on direct, unoptimized GA4 connections. Professional templates differentiate themselves not by their color schemes, but by their underlying data architecture—specifically their use of data extraction and caching to bypass these API limits entirely.
Amateur templates are built for aesthetics; professional templates are engineered for stability. When evaluating a catalog of examples, the first question should never be "Does this look good?" but rather, "Is this report quota-resistant?"
A Catalog of Professional Looker Studio Examples by Category
To build a highly effective reporting suite, teams typically need specialized dashboards tailored to specific marketing disciplines. A one-size-fits-all approach rarely provides the depth required for granular optimization. Below is a curated breakdown of the primary categories of professional templates available in the market today.
SEO and Organic Search Templates
Organic search reporting requires merging data from Google Search Console (GSC) with behavioral data from GA4. A top-tier SEO template goes far beyond tracking basic keyword rankings. Professional examples, such as the comprehensive "Local SEO Bundles" offered by specialized creators, often span 10 to 15 pages.
These templates typically feature:
- Keyword Cannibalization Monitors: Tables that automatically highlight when multiple URLs are competing for the same search term.
- Striking Distance Reports: Filters that isolate keywords ranking in positions 11-20, identifying quick-win opportunities for content optimization.
- Core Web Vitals Mapping: Blending technical site speed metrics with organic bounce rates to prove the ROI of technical SEO fixes.
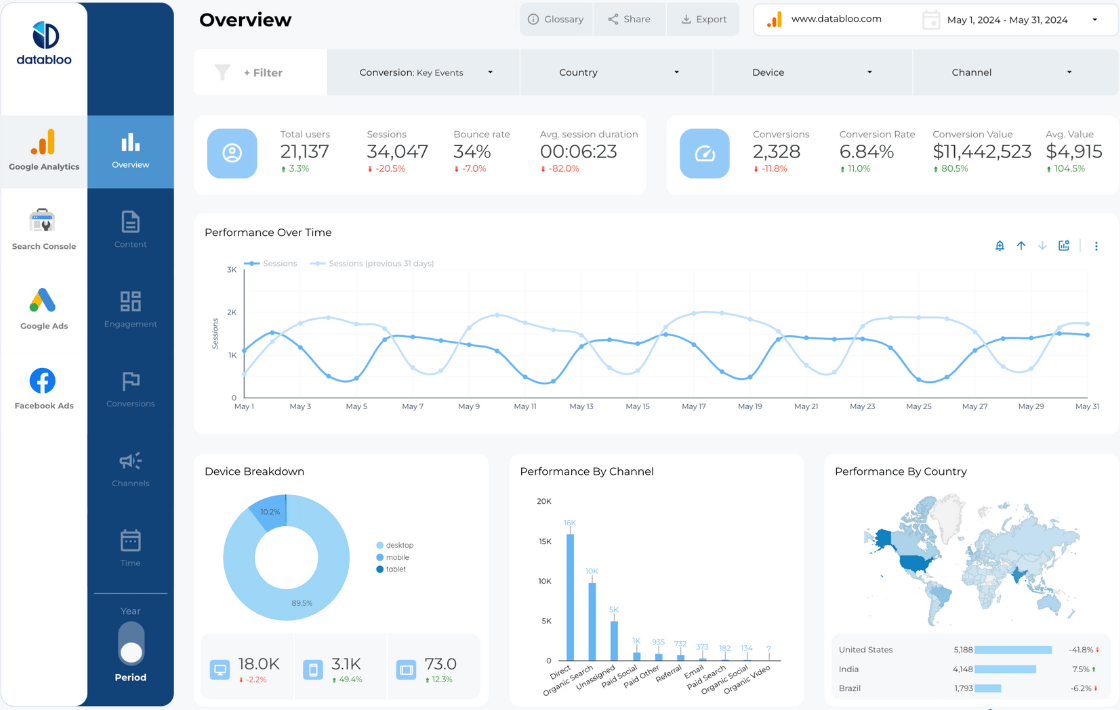
Image source: Data Bloo
Paid Media and PPC Dashboards
The primary challenge in Paid Media reporting is the fragmentation of platforms. Clients do not want to see separate reports for Google Ads, Meta Ads, LinkedIn Ads, and TikTok Ads; they want a unified view of their total advertising spend and blended Return on Ad Spend (ROAS).
Professional PPC templates utilize a technique called "Data Blending." By using a common join key (typically the Date), these templates merge spend data from multiple platforms into a single scorecard. This allows agencies to present a true, cross-channel Cost Per Acquisition (CPA). Furthermore, advanced templates include pacing trackers—visual gauges that show exactly how much of the monthly budget has been spent versus how much should have been spent by the current day of the month.
E-commerce and Shopify Reports
E-commerce templates require the most rigorous data validation. A discrepancy between the revenue reported in Looker Studio and the revenue sitting in the client's Shopify or WooCommerce bank account will immediately destroy trust.
High-quality e-commerce examples focus heavily on funnel visualization. Instead of just showing total sales, they map the entire customer journey: Total Sessions → Product Views → Add to Cart → Initiate Checkout → Purchase. By visualizing the drop-off rate at each stage, marketers can pinpoint exactly where the user experience is failing. Additionally, these templates often include cohort analysis, tracking the lifetime value (LTV) of customers acquired during specific seasonal campaigns.
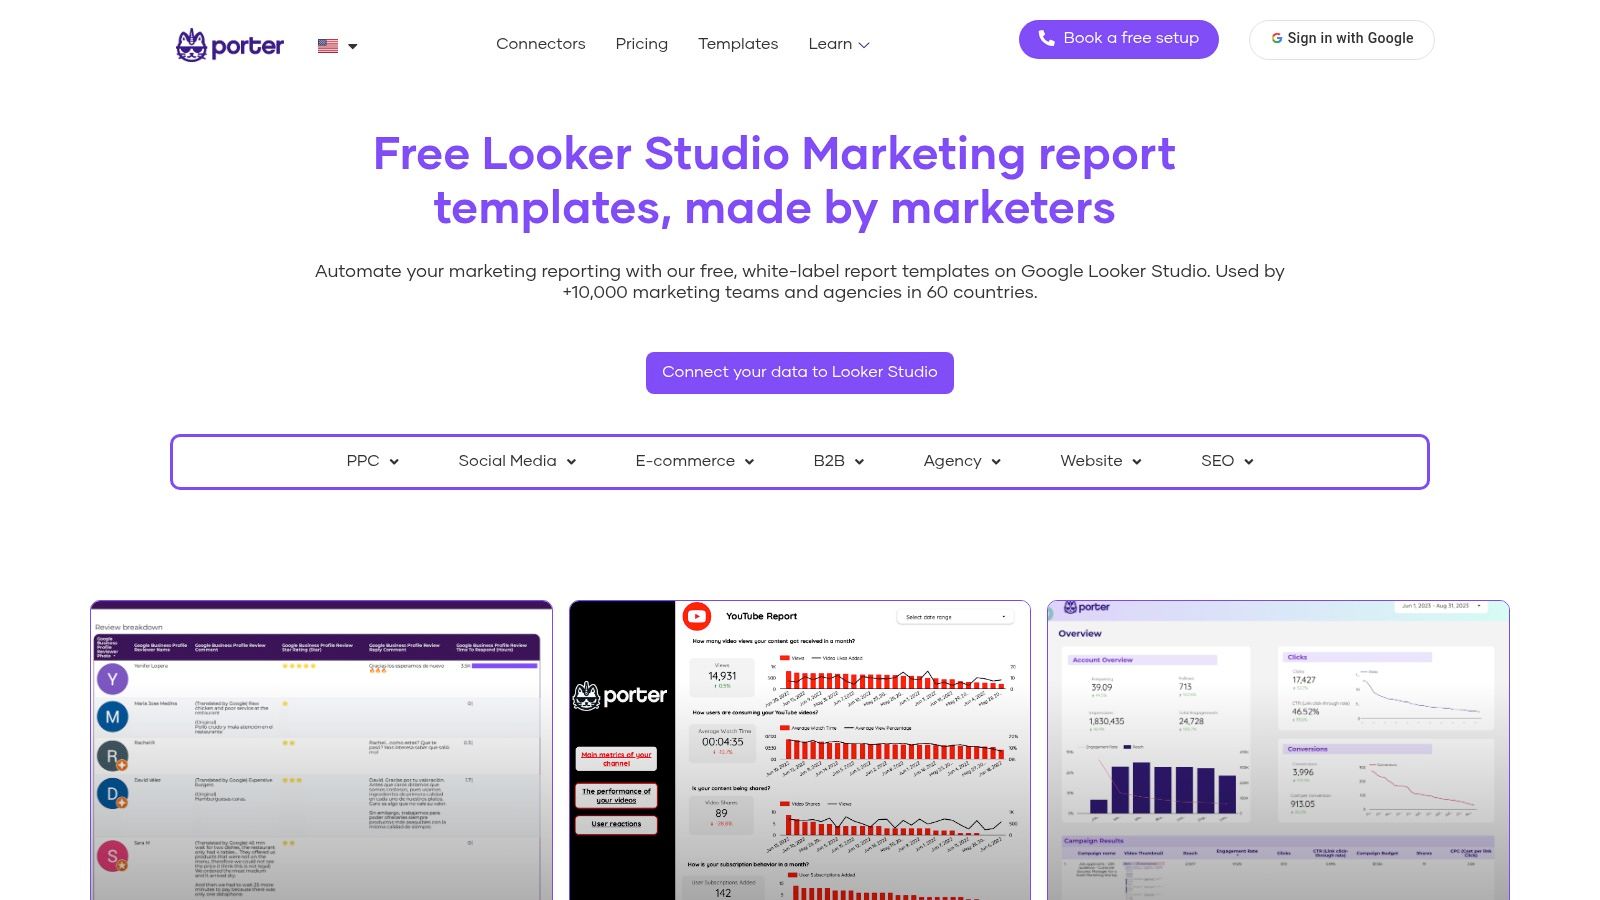
Image source: MetricsWatch
Niche and Emerging Use Cases
As the digital landscape evolves, so do the templates required to measure it. In recent months, several highly specialized templates have emerged to address new industry challenges:
- AI Traffic Tracking: With the rise of Large Language Models, specialized templates now exist to isolate and track referral traffic coming specifically from ChatGPT, Perplexity, Gemini, and Claude. This allows SEOs to measure their visibility in AI-driven search environments.
- GA4 Health Audits: Rather than reporting on marketing performance, these templates act as diagnostic tools. They automatically scan a GA4 property for configuration errors, missing custom events, broken conversion tracking, and data retention anomalies, providing a "health score" for the analytics setup.
How to Choose the Right Template Provider for Your Agency
The market for Looker Studio templates is vast, ranging from free community contributions to enterprise-grade subscription services. Selecting the right provider depends entirely on your technical resources, your budget, and the volume of data you process.
When browsing a catalog, it is crucial to distinguish between a "Free Template" and a "Free Demo." Many providers offer free templates that are permanently functional, provided you use native Google connectors. However, others offer templates that are technically free to copy, but require a paid third-party connector (like Supermetrics or Windsor.ai) to actually populate with your data. Understanding this distinction prevents frustration during the setup process.
| Provider Name | Primary Focus | Pricing Model | Connector Requirement | White-Labeling |
|---|---|---|---|---|
| Google Gallery | Basic Analytics & Ads | 100% Free | Native Google Connectors | Manual Customization |
| Supermetrics | Enterprise Cross-Channel | Premium Subscription | Supermetrics Connectors | Full Agency Branding |
| Windsor.ai | Multi-Touch Attribution | Freemium / Paid | Windsor.ai (325+ Apps) | Full Agency Branding |
| Portermetrics | Social Media & Local SEO | Premium Subscription | Portermetrics Connectors | Full Agency Branding |
| Data Bloo | High-End Visual Design | One-Time Purchase | Native or 3rd Party | Extensive Customization |
For marketing agencies, white-labeling capabilities are a non-negotiable requirement. A professional template must allow the agency to easily swap out logos, adjust the global color palette to match the client's brand guidelines (using specific hex codes), and remove any branding from the original template creator. Providers that lock their branding into the report background should generally be avoided for client-facing deliverables.
Technical Features That Separate Professional Reports from Amateurs
Visual polish is only the surface layer of a professional Looker Studio report. The true value lies in the technical engineering beneath the charts. When evaluating a template catalog, look for these specific advanced features that indicate a high-quality build.
The Extract Data Connector
As discussed regarding the GA4 API quota crisis, direct connections are prone to failure. Professional templates solve this by utilizing Looker Studio's native "Extract Data" connector. Instead of querying GA4 every time a user changes a date range, the Extract Data connector pulls a static snapshot of the data (up to 100MB) and stores it in Looker Studio's cache. This cache is then updated on a scheduled basis (e.g., daily at 6:00 AM). This approach completely bypasses the real-time API limits, ensuring the report never crashes during a presentation, and typically improves dashboard load times by up to 5x.
Smart Interpretations
Data without context is just noise. A growing trend in professional reporting is the inclusion of "Smart Interpretations." Instead of relying solely on the client to interpret a line chart, these templates use complex CASE statements and calculated fields to generate dynamic text summaries. For example, a text box might automatically read: "Organic traffic increased by 15% this month, primarily driven by a surge in non-branded search terms on mobile devices." This feature saves analysts hours of manual summary writing each month.
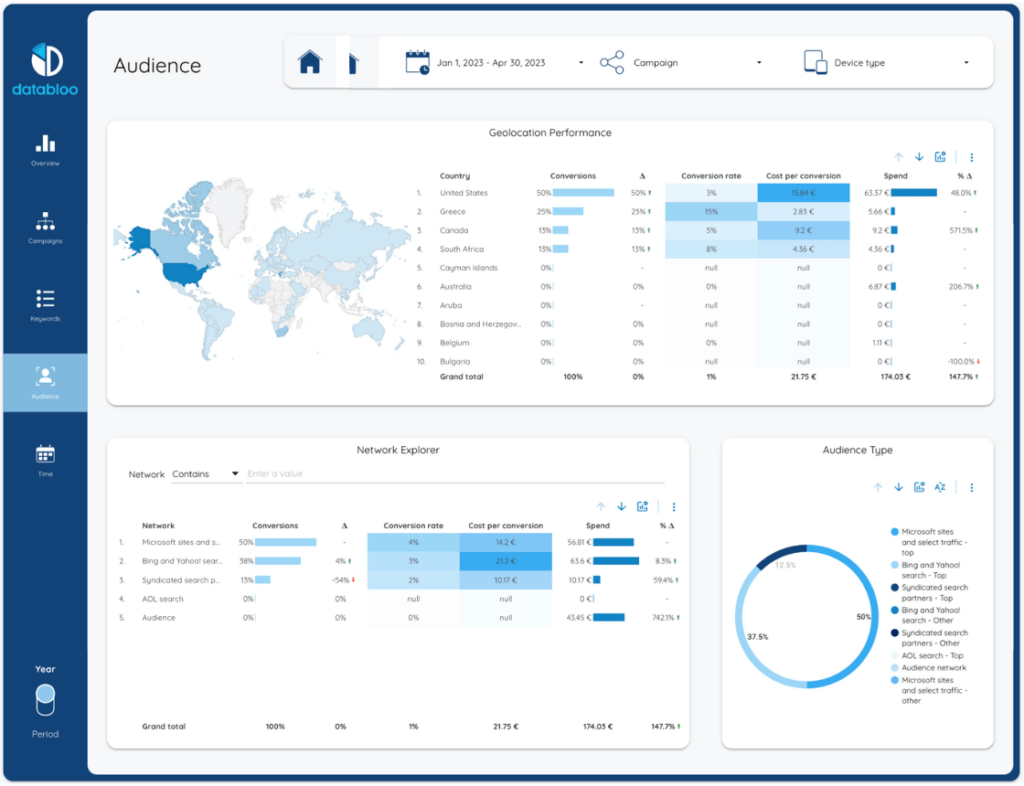
Image source: Data Bloo
Sidebar Navigation
Standard Looker Studio reports place page navigation in a dropdown menu at the top left of the screen. For reports exceeding three pages, this creates a poor user experience. Professional templates utilize custom-built sidebar navigation. By using shapes, text boxes, and hyperlinked elements set to "Report-Level" visibility, creators build a persistent left-hand menu that mimics the feel of a standalone software application, making it significantly easier for clients to navigate between SEO, PPC, and Social Media sections.
Currency Switching
For agencies managing international clients, currency conversion is a persistent headache. Advanced templates utilize Looker Studio's "Parameters" feature combined with calculated fields to create a seamless currency toggle. A single dropdown menu allows the viewer to switch the entire dashboard's financial metrics from USD to EUR to GBP instantly, applying real-time or static exchange rates without requiring the analyst to duplicate pages or data sources.
Step-by-Step Guide to Setting Up a Professional Template in Under Five Minutes
One of the primary benefits of using a pre-built template is the speed of deployment. However, the process of copying a template and mapping the data correctly can be confusing for first-time users. Follow this standardized workflow to deploy a template safely and accurately.
-
Select and Authorize the Source Connector
Before opening the template, ensure you have access to the necessary data. If the template requires a third-party connector (like Windsor.ai, which supports over 325 business apps), log into that service first and authorize the connection to your client's ad accounts or CRM. -
Initiate the "Make a Copy" Workflow
Open the template link provided by the catalog. In the top right corner of the Looker Studio interface, click the three vertical dots (More options) and select "Make a copy." Do not attempt to request edit access to the original file. -
Map the Data Sources Carefully
A dialog box will appear showing the "Original Data Source" on the left and a dropdown for the "New Data Source" on the right. Click the dropdown and select your client's specific data source. If you are using an Extract Data source, select that here. Ensure that you map GA4 to GA4, and Google Ads to Google Ads; mixing source types will break the charts. -
Apply Report-Level Theme and Layout Settings
Once the copy is generated, immediately navigate to Theme and Layout. Update the primary and secondary colors to match your agency's branding. Replace the placeholder logo with your client's logo, right-click it, and select "Make report-level" so it automatically populates across all pages of the dashboard. -
Test the Quota and Resource Usage
Before sending the link to a client, verify its stability. Right-click anywhere on the canvas and select "Google Analytics Token Usage" (if connected directly to GA4). Ensure that loading the page consumes a reasonable fraction of the 1,250 limit. Click through various date ranges to ensure the charts render quickly without triggering errors.
Advanced Strategies for Enterprise-Level Reporting
While the Extract Data connector is an excellent solution for mid-sized agencies, enterprise organizations processing millions of rows of data require a more robust architecture. When standard templates are no longer sufficient, data engineering must take precedence over data visualization.
The BigQuery Path
For high-traffic websites and large-scale advertising campaigns, the only truly permanent solution to API limits and slow load times is Google BigQuery. By setting up a daily export of GA4 data into a BigQuery data warehouse, agencies bypass the GA4 API entirely. Looker Studio connects natively to BigQuery, and because BigQuery is designed to process massive datasets in seconds, dashboards load almost instantaneously. While this requires basic SQL knowledge to set up the initial views, it is widely regarded as a top-tier solution for enterprise reporting.
Efficiency Gains and Automation
The transition from manual reporting to automated, quota-resistant templates yields significant operational benefits. Industry case studies highlight the impact of this shift; for instance, organizations like Philips Healthcare reportedly saved up to 40% of their data analysts' time by migrating to automated, stable reporting architectures. This time, previously spent fixing broken charts and manually exporting CSVs, can be redirected toward actual data analysis and strategic planning.
Data Blending Secrets: CRM Integration
The final frontier of professional Looker Studio templates is closing the loop between marketing spend and actual business revenue. Advanced templates achieve this by blending marketing data with CRM data (such as Salesforce or HubSpot). By using a "Left Outer Join" on a common identifier (like a Campaign ID or UTM parameter), analysts can build templates that track a user from their first Google Ads click all the way through to a closed-won sales deal, revealing the true Return on Investment (ROI) of marketing efforts.
Frequently Asked Questions
- How do I add a downloaded template to Looker Studio?
- To add a template, open the provided template link in your browser while logged into your Google account. Click the three vertical dots in the top right corner and select "Make a copy." You will then be prompted to replace the template's original data sources with your own connected data sources.
- Are there free professional Looker Studio templates for GA4?
- Yes, the official Google Looker Studio Gallery offers several free templates. However, users should be aware that many free templates connect directly to the GA4 API, which can lead to "Quota Exceeded" errors on high-traffic sites. For production use, it is highly recommended to modify free templates to use the Extract Data connector.
- What makes a Looker Studio report "professional" compared to a basic one?
- A professional report is characterized by technical stability (quota resistance), consistent branding, intuitive multi-page navigation (like sidebars), automated text insights, and the ability to blend data from multiple sources to provide cross-channel metrics rather than isolated platform data.
- Can I white-label Looker Studio templates for my agency clients?
- Yes. Once you copy a template, you have full edit access. You can change the color palette in the "Theme and Layout" menu, upload your agency's or client's logo, and remove any branding from the original creator. You can also host the report on a custom domain using third-party embedding tools.
- Why is my Looker Studio report showing a "Quota Exceeded" error?
- This error occurs because Google Analytics 4 enforces a strict limit of 1,250 API tokens per hour per property. If your dashboard has many complex charts or is viewed by multiple people simultaneously, it quickly exhausts this limit. To fix this, switch your data source connection to Looker Studio's "Extract Data" feature or route your data through Google BigQuery.
Final Thoughts
Building a reporting suite in Looker Studio is no longer just an exercise in graphic design; it requires a foundational understanding of data architecture. By selecting templates that prioritize stability and advanced features, agencies can deliver insights that drive real business value without the fear of technical breakdowns.
- Prioritize quota-resistant architecture: Always use the Extract Data connector or BigQuery for GA4 reports to prevent API crashes during client presentations.
- Implement data blending: Merge Google Ads, Meta Ads, and GA4 data to calculate a true, cross-channel Cost Per Acquisition (CPA).
- Upgrade your navigation: Utilize custom sidebar menus for any report exceeding three pages to drastically improve the client user experience.
- Automate your insights: Incorporate Smart Interpretations and calculated fields to provide written context, saving hours of manual analysis.
- Standardize your branding: Use Report-Level components to lock logos and color themes across all pages of your white-labeled dashboards.
Audit your current Looker Studio dashboards today by checking their GA4 token usage, and begin migrating your most critical client reports to an extracted data source.