How to Measure Productivity with Collaboration Tools Using Outcome-Based Metrics and Native Analytics
To accurately measure productivity with collaboration tools, organizations must shift from tracking activity (hours online or keystrokes) to tracking outcomes. This involves utilizing native analytics within platforms like Slack and Microsoft Teams to monitor goal achievement rates, deep work blocks, and information-gathering efficiency. By combining quantitative metadata with qualitative sentiment signals, managers can assess true business value without resorting to intrusive surveillance that damages team trust.
The modern workplace has fundamentally changed, but the way many organizations evaluate performance remains stuck in the past. In 2026, "visibility" no longer equals "value." Despite the widespread adoption of advanced digital workspaces, 27% of executives still measure productivity by tracking activity metrics like hours spent online or messages sent. In stark contrast, only 19% focus on actual key performance indicators (KPIs) and business outcomes.
This reliance on outdated input metrics creates a dangerous illusion of productivity. When employees know they are being judged by their green "active" dot on Slack or Microsoft Teams, they engage in productivity theater—moving their mouse or sending unnecessary messages just to appear busy. Effective measurement requires a paradigm shift. It requires looking at the data already living in your collaboration stack to understand how work is actually getting done, where bottlenecks exist, and how teams are achieving their goals.
If you are worried that flexible work limits productivity, the data suggests the opposite. According to recent workplace analytics, 55% of employees with flexible work options are classified as high performers, compared to only 36% of employees in traditional, rigid office settings. The key is not forcing visibility, but optimizing how collaboration tools are used to facilitate deep work.
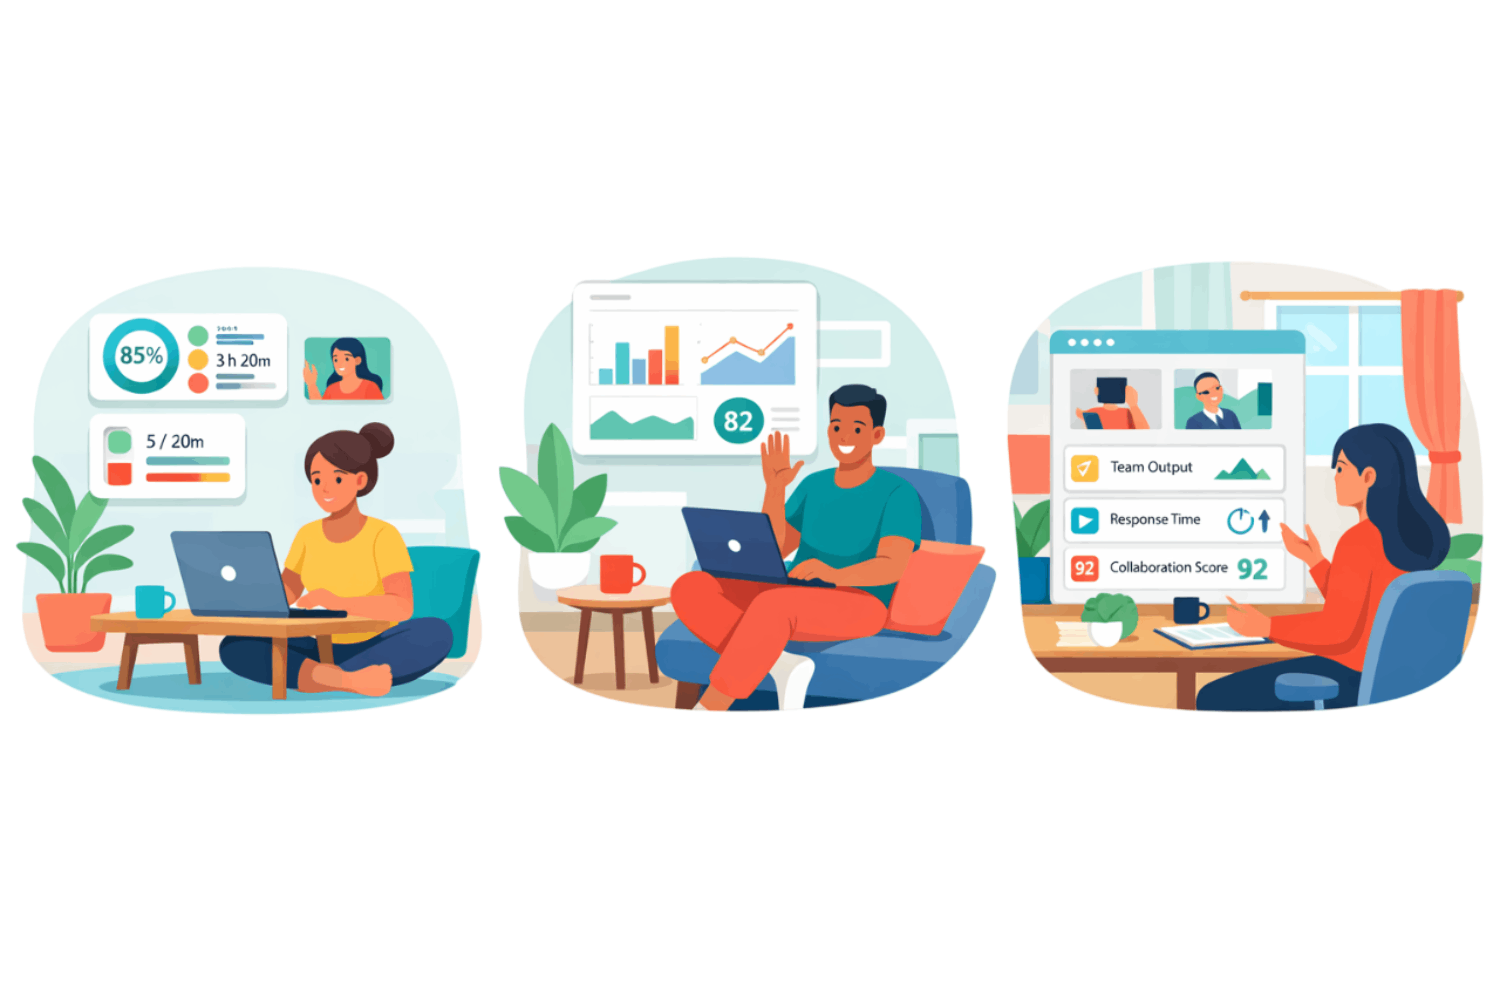
Image source: Worklytics
Why Traditional Productivity Metrics Fail in a Collaborative Environment
Before implementing a new measurement framework, it is crucial to understand why traditional metrics—like hours logged, emails sent, or tasks checked off—fail to capture the reality of modern knowledge work. In a highly collaborative digital environment, high activity can actually be a symptom of inefficiency rather than a sign of hard work.
The Toggling Tax and Context Switching
One of the most significant hidden drains on team output is the "toggling tax." This refers to the cognitive load and time lost when employees constantly switch between different applications to find information, answer messages, and complete tasks. Research indicates that employees lose an astonishing 32 days per year simply switching between workplace applications.
If a manager is only looking at activity metrics, an employee who spends three hours jumping between Jira, Slack, Google Drive, and Salesforce might look incredibly "active." However, that activity is pure friction. True productivity measurement must account for context switching. High-performing teams typically show longer periods of uninterrupted focus time within a single application, rather than frantic, cross-platform toggling.
The Danger of Surveillance Backfire
In an attempt to regain the visibility lost during the shift to remote and hybrid work, many companies invested heavily in employee monitoring software. While approximately 80% of companies monitor remote workers in some capacity, this approach frequently backfires. Studies show that nearly 50% of employees would consider quitting if surveillance increased.
There is a massive difference between *monitoring* (which is often perceived as creepy and intrusive) and *measurement* (which is constructive and outcome-focused). Tracking keystrokes or taking random screenshots destroys psychological safety. When trust erodes, employees stop taking creative risks, collaboration stalls, and overall output plummets. The goal of measuring productivity with collaboration tools should be to identify systemic roadblocks, not to micromanage individual daily habits.
The Information Search Drain
Another area where traditional metrics fall short is accounting for the time spent simply trying to do the job. The average knowledge worker spends 2.5 hours per day just gathering information. If your collaboration tools are disorganized—with critical documents buried in endless chat threads or siloed in private direct messages—your team is losing a massive portion of their week to administrative overhead.
When evaluating productivity, organizations must assess the structural efficiency of their digital workspace. If an employee takes longer to complete a project, is it because they are underperforming, or is it because the company's knowledge base is fragmented across too many poorly integrated tools?
5 Key Collaboration KPIs That Actually Matter
To move away from activity tracking, organizations need a new set of Key Performance Indicators (KPIs) that reflect the realities of digital collaboration. These metrics focus on how effectively a team works together to produce business value.
Tracking Goal and Milestone Achievement Rates
The most fundamental measure of productivity is whether the work is actually getting done. Instead of counting the number of micro-tasks an employee checks off in Asana or Trello, zoom out to measure the milestone achievement rate. Are projects being delivered on time? Are the deliverables meeting quality standards? By integrating project management tools directly into Slack or Teams, managers can track the velocity of major milestones without needing to micromanage the individual steps taken to get there.
Balancing Response Time Versus Deep Work Blocks
In many company cultures, a fast response time on Slack is mistakenly equated with high performance. However, constant availability is the enemy of deep work. A more sophisticated KPI measures the balance between collaboration time and focus time. Using calendar integrations, managers can track how many uninterrupted two-hour blocks of "Deep Work" employees are getting each week. A healthy productivity profile typically shows a balance: reasonable response times during designated collaboration hours, protected by extended periods of offline focus.
Evaluating Meeting Density and Quality
Meetings are often the default method of collaboration, but they are frequently the biggest drain on productivity. Experts suggest that meeting frequency and density must be carefully audited. Are meetings driving outcomes, or are they just filling calendars? A valuable KPI is the ratio of synchronous communication (live meetings) to asynchronous communication (shared documents, recorded video updates). Teams that successfully shift routine status updates to asynchronous channels typically demonstrate higher overall output.
Measuring Information Gathering Efficiency
How quickly can a new team member find a critical resource in your collaboration platform? Information gathering efficiency can be measured by looking at search query success rates within your internal wikis or collaboration tools. If employees are constantly asking the same questions in public channels, it indicates a failure in knowledge management. High productivity requires a digital environment where information is easily discoverable without needing to interrupt a colleague.
Capturing the Qualitative Sentiment Signal
Not all productivity can be quantified by hard data. The "Sentiment Signal" is a crucial qualitative metric. This involves tracking micro-collaborations—such as the frequency of "thank yous," peer recognitions, shared wins, or even the use of custom emojis in celebration channels. Triangulating quantitative app usage data with qualitative sentiment provides a much more accurate picture of team health. A team that delivers on time but exhibits toxic, siloed communication patterns is likely on the verge of burnout and long-term productivity collapse.
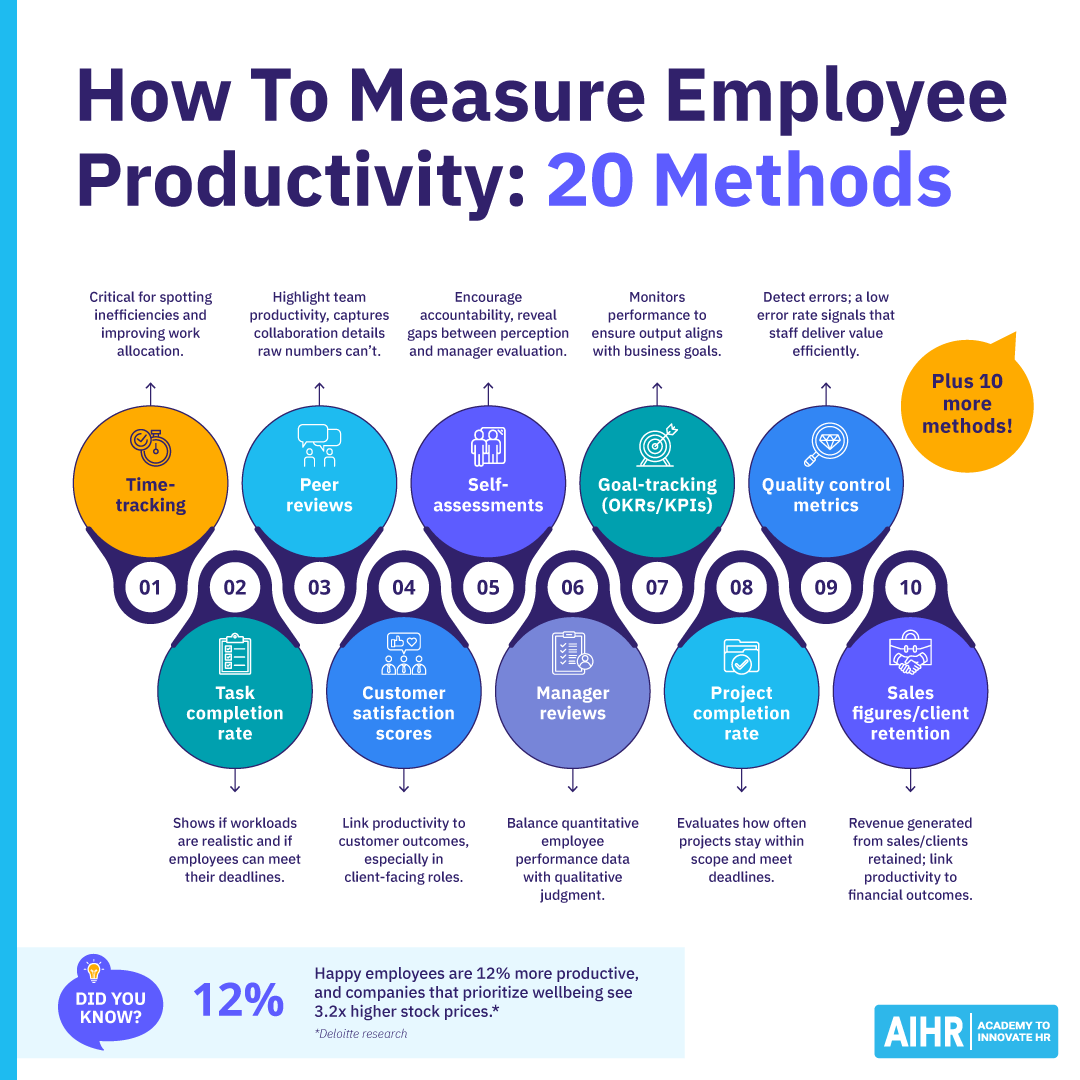
Image source: AIHR
How to Measure Productivity in Slack and Microsoft Teams Without Extra Software
Many organizations assume they need to purchase expensive third-party software to understand how their teams are working. However, the native analytics built into enterprise collaboration platforms already provide a wealth of non-intrusive data that can be used to gauge organizational health and workflow efficiency.
Accessing Native Slack Analytics
Slack offers a robust Analytics Dashboard available to workspace administrators. To access it, navigate to your workspace menu, select "Tools & settings," and click on "Analytics." Here, managers should look beyond the basic "messages sent" metric.
The most valuable insight in Slack Analytics is the ratio of public channel engagement to private Direct Messages (DMs). If 80% of your organization's communication is happening in private DMs, it is a strong indicator of knowledge hoarding or a lack of psychological safety in public forums. Healthy, productive teams typically have a higher percentage of communication occurring in public or project-specific channels, ensuring that knowledge is searchable and accessible to the wider team.
Leveraging Microsoft Teams Usage Reports
For organizations in the Microsoft ecosystem, the Microsoft 365 Admin Center provides detailed Teams Usage Reports. These reports can show active users, channel usage, and the balance between chat messages and audio/video calls.
A key metric to analyze here is cross-functional collaboration. Are the marketing and sales teams interacting in shared channels, or are they operating in complete isolation? By analyzing the network graph of how different departments interact within Teams, leaders can identify organizational silos that are slowing down project delivery and stifling innovation.
Executing the Native Audit Workflow
You can perform a basic productivity audit using native tools by following this three-step workflow:
- Export 30 Days of Activity Data: Pull the last month of channel activity and meeting data from your platform's admin console.
- Cross-Reference with Project Delivery: Overlay this communication data with your project management timelines. Look for patterns. Do spikes in meeting hours correlate with faster project delivery, or do they correlate with missed deadlines?
- Identify Bottleneck Channels: Look for channels where questions frequently go unanswered for more than 24 hours, or where communication abruptly stalls. These are your workflow bottlenecks that require managerial intervention.
Role-Specific Productivity Formulas for Modern Teams
One of the biggest mistakes companies make is applying a monolithic productivity metric across the entire organization. The way a software engineer produces value is fundamentally different from the way a sales representative does. In 2026, productivity measurement must be tailored to specific roles.
How Developers Can Measure Sprint Velocity and Code Quality
For engineering and development teams, activity in Slack is largely irrelevant to their actual output. Instead, productivity should be measured through integrations with tools like GitHub, GitLab, and Jira. Workplace productivity analytics for hybrid teams suggest focusing on "Sprint Velocity" (the amount of work completed in a set timeframe) and "Code Quality" (measured by the number of bugs reported post-deployment or the efficiency of code reviews). A highly productive developer might send very few messages but consistently merge high-quality, peer-reviewed code on schedule.
Tracking CRM Velocity and Deal Closure for Sales Teams
Sales productivity is inherently outcome-based, but collaboration tools play a vital role in the process. For sales teams, managers should measure the "collaboration-to-close" ratio. This involves tracking how effectively sales reps utilize internal subject matter experts (like sales engineers or product managers) via collaboration channels to move deals forward. The ultimate metrics remain CRM velocity (how fast a lead moves through the pipeline) and total deals closed, but analyzing how internal collaboration supports those outcomes can highlight best practices that can be scaled across the team.
Calculating the AI Leverage Ratio for Knowledge Workers
The integration of Artificial Intelligence into the workplace has fundamentally altered knowledge work. Currently, 71% of workers are performing tasks outside their core job descriptions as AI automates routine, low-level tasks. For marketers, writers, and analysts, productivity is no longer about how fast they can type or how many reports they can manually generate.
Instead, managers should look at the "AI Leverage Ratio." This measures how effectively an employee uses AI tools (often integrated directly into Slack or Teams) to offload administrative work, thereby freeing up time for high-level ideation, strategy, and complex problem-solving. An employee who uses AI to summarize a 50-message thread and immediately drafts a strategic response is demonstrating high productivity, even if their raw "time spent typing" has decreased.
Choosing the Right Productivity Tracking Software
If native analytics are not sufficient for your organization's needs, you may consider third-party productivity tracking software. However, the market is heavily divided between tools that use non-intrusive metadata and those that rely on invasive activity monitoring. Choosing the wrong tool can devastate company culture.
| Software Type | Data Source | Privacy Level | Primary Focus | Best For |
|---|---|---|---|---|
| Non-Intrusive Analytics (e.g., Worklytics) | Application Metadata, Calendar APIs, O365/Google Workspace integrations | High (Data is often anonymized and aggregated at the team level) | Workflow friction, meeting overload, cross-functional collaboration patterns | High-trust, creative, and complex knowledge-work environments |
| Workforce Analytics (e.g., ActivTrak) | Application usage time, website categorization, focus time tracking | Medium (Tracks individual app usage but typically avoids screen recording) | Identifying burnout, balancing workloads, measuring focus vs. distraction | Hybrid teams needing baseline operational visibility without extreme surveillance |
| Activity Monitoring (e.g., Monitask, Controlio) | Keystroke logging, random screenshots, active mouse tracking | Low (Highly intrusive, monitors granular individual behavior) | Proof of work, time-theft prevention, strict compliance | Highly regulated industries, strict hourly billing, or highly transactional task-based work |
Decision Framework for Matching Tools to Company Culture
When selecting a tool, you must align the software's capabilities with your organizational goals. If your primary goal is to foster innovation and prevent burnout among highly skilled knowledge workers, you should strictly utilize Non-Intrusive Analytics. These tools analyze the *exhaust data* of collaboration (like meeting metadata) to provide insights without ever looking at the content of messages or tracking keystrokes.
Conversely, if you are managing a team of hourly data-entry contractors where output is strictly linear and transactional, Activity Monitoring might be legally or operationally required. However, be aware that applying Activity Monitoring to creative or strategic roles will almost certainly result in high turnover and a collapse in morale.
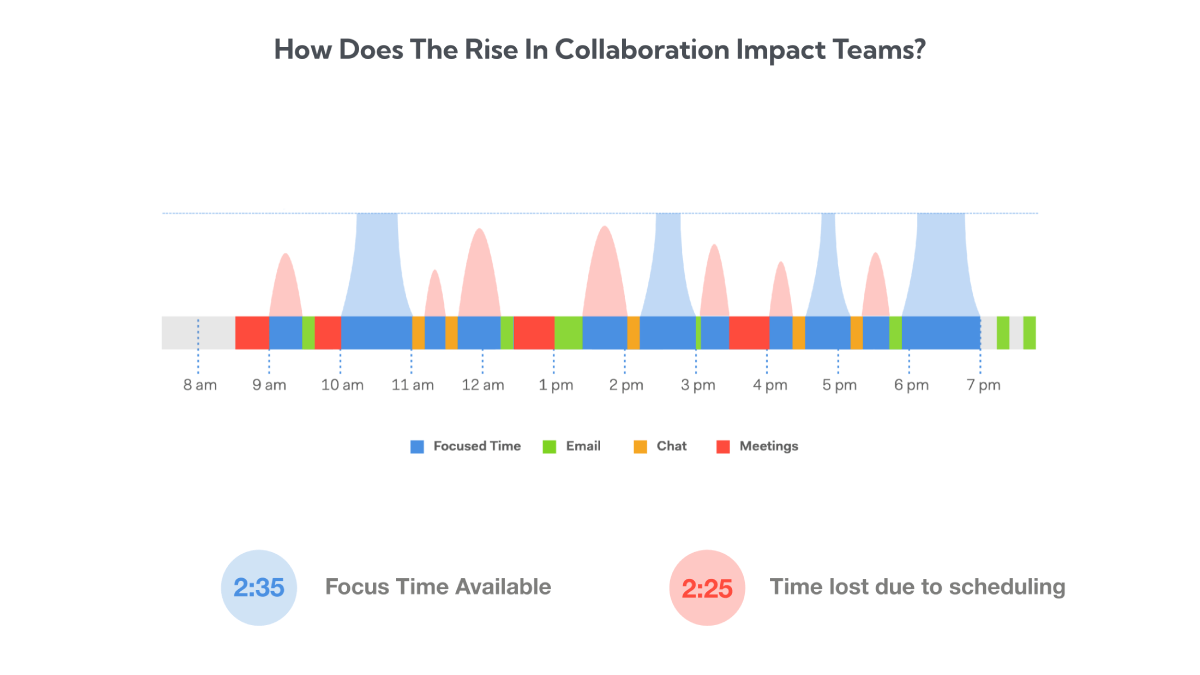
Image source: Worklytics
Using Collaboration Data as a Safety Net for Burnout
Perhaps the most valuable, yet underutilized, application of productivity measurement is using the data proactively to protect employee well-being. Rather than using analytics to "catch" employees who are working too little, forward-thinking managers use collaboration data to identify employees who are working too much.
Identifying the Always-On Culture
Collaboration tools make it incredibly easy for work to bleed into personal time. By analyzing timestamp data on messages and commits, managers can identify the "Always-On" culture. If a significant portion of your team is consistently sending Slack messages or updating Jira tickets at 9:00 PM or on weekends, it is a glaring red flag. While this might look like "high productivity" in the short term, it is a leading indicator of impending burnout and turnover. Managers can use this data to enforce core working hours and encourage employees to disconnect.
Spotting the Moonlighting Signal
The rising cost of living has led to an increase in employees taking on secondary jobs. Recent data shows that 4.8% of employed people in the US hold multiple jobs, a trend often referred to as "overemployment" or moonlighting. Furthermore, 34% of employees report high stress levels, with 10% stating they are unable to be productive due to financial stress.
Erratic collaboration patterns—such as an employee who is completely unresponsive for large blocks of the core workday but highly active late at night—can sometimes be a signal of moonlighting or severe personal stress. Instead of immediately moving to disciplinary action, managers should use these collaboration anomalies as a prompt to check in on the employee's workload, well-being, and engagement levels.
Implementing Proactive Intervention Strategies
When collaboration data indicates that an employee is overloaded—perhaps their meeting density has spiked to 30 hours a week, leaving no time for deep work—managers must intervene proactively. This might involve reassigning projects, declining meetings on the employee's behalf, or adjusting deadlines. When productivity data is used as a tool for employee support rather than just management oversight, it builds trust and fosters a sustainable, high-performing culture.
Frequently Asked Questions
Final Thoughts
Measuring productivity in a digital-first environment requires abandoning the industrial-era mindset of tracking hours and keystrokes. To build a high-performing, resilient team in 2026, organizations must leverage the data within their collaboration tools to understand workflows, eliminate friction, and support their employees.
- Focus on outcomes over activity: Stop tracking how many messages an employee sends and start tracking their milestone achievement rates and project delivery velocity.
- Audit your toggling tax: Recognize that constant app-switching destroys focus; aim to consolidate workflows to reclaim the 32 days a year lost to digital friction.
- Utilize native analytics first: Before purchasing third-party software, explore the built-in usage reports in Slack or Microsoft Teams to understand your team's communication patterns.
- Tailor metrics to the role: Apply specific formulas, like Sprint Velocity for developers or the AI Leverage Ratio for knowledge workers, rather than a one-size-fits-all metric.
- Use data to prevent burnout: Monitor after-hours collaboration timestamps to identify overworked employees and proactively adjust their workloads before they quit.
- Prioritize trust over surveillance: Avoid intrusive screen-recording tools that destroy psychological safety, opting instead for non-intrusive metadata analysis.