How to Build a Professional SEO Analysis Template That Actually Drives Results
A professional SEO analysis template moves beyond simple data dumping. Instead of just reporting what happened (e.g., "traffic dropped 10%"), an effective template diagnoses why it happened and prescribes actionable next steps. In 2026, a top-tier template must integrate Google Search Console click data, AI Overview inclusion rates, and technical rendering metrics into a unified workflow that connects organic visibility directly to revenue.
There is a fundamental difference between SEO reporting and SEO analysis. Reporting is the act of gathering data; analysis is the act of interpreting it. Many digital marketing agencies and in-house teams struggle because they rely on automated dashboards that spit out charts without providing context. When stakeholders see a sea of red and green arrows without a narrative, trust erodes quickly.
According to industry experts at Ahrefs, a highly effective report communicates the impact of your work, rather than just the volume of tasks completed. If a client or executive has not been educated on why specific metrics matter, even a flawless data presentation will lead to frustration.
This guide breaks down exactly how to construct a comprehensive SEO analysis template for 2026. We will explore the critical metrics to track, how to build a cross-tool workflow using Google Sheets, and how to present your findings in a way that secures buy-in and drives strategic growth.
What Should Every Modern SEO Analysis Template Include?
Before diving into advanced workflows, your template must establish a solid foundation. While the specific layout may vary depending on whether you use a spreadsheet, a slide deck, or a dedicated SaaS platform, the core data pillars remain consistent. A comprehensive template should cover the following four areas:
This section pulls data primarily from Google Analytics 4 (GA4). It should track total sessions, engaged sessions, and new users specifically filtered for the "Organic Search" channel group. Comparing Month-over-Month (MoM) and Year-over-Year (YoY) data is essential to account for seasonal fluctuations.
Moving beyond simple "average position" metrics, this section utilizes Google Search Console (GSC) data. It must highlight impressions, clicks, and Click-Through Rate (CTR). Tracking CTR is particularly vital as SERP features continue to evolve and push traditional organic links further down the page.
Traffic without revenue is a vanity metric. Your template must connect organic sessions to tangible business outcomes. This includes tracking form submissions, lead generation, e-commerce purchases, and assisted conversions to demonstrate the full-funnel ROI of your SEO efforts.
Using tools like Ahrefs or Semrush, this section monitors the acquisition of new referring domains versus lost domains. It should also track the overall growth of domain authority metrics and highlight any toxic links that may require a disavow file update.
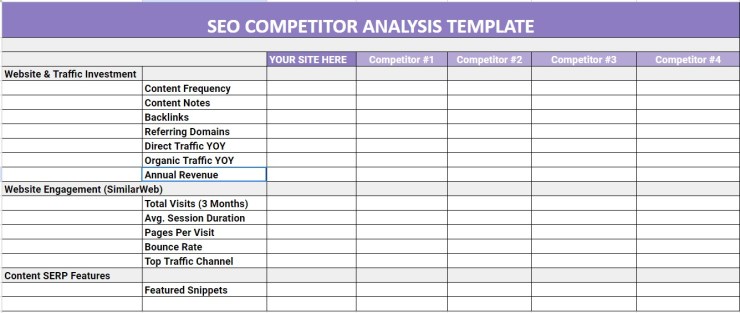
Image source: The Media Ant
How to Track AI Overviews and Position Zero Wins
The search landscape has shifted dramatically. Tracking traditional "blue links" is no longer sufficient for a complete analysis. With the integration of generative AI into search engines, users frequently receive their answers directly at the top of the Search Engine Results Page (SERP) without needing to click through to a website.
To maintain a competitive edge, your SEO analysis template must include metrics for AI Overview (AIO) visibility and "Position Zero" features. Reporting platforms like Swydo emphasize that adapting to these new SERP features is critical for accurate performance measurement.
Measuring AIO Inclusion Rate
Your template should feature a dedicated row or dashboard widget for "AIO Inclusion Rate." This metric represents the percentage of your target queries where your brand is cited as a source within the AI-generated summary. Because Google Search Console does not currently separate AIO clicks from standard organic clicks with perfect clarity, SEOs must rely on third-party rank trackers (like Advanced Web Ranking or Semrush's Sensor) to monitor how often their URLs appear in these generative spaces.
Tracking Featured Snippets and PAA
Alongside AI Overviews, tracking Featured Snippets and "People Also Ask" (PAA) boxes remains crucial. When analyzing a drop in organic traffic, the template should prompt the analyst to check if a competitor recently captured a Featured Snippet that your site previously held. A loss at Position Zero often explains a sudden CTR drop even when the traditional ranking position remains stable.
Why You Must Separate Branded from Non-Branded Traffic
One of the most common flaws in basic SEO reporting is grouping all organic traffic together. If a company runs a highly successful television commercial or viral social media campaign, brand awareness will spike. Consequently, users will search for the company's name directly, driving up organic traffic in Google Analytics.
If your template does not separate this data, you might falsely attribute this traffic spike to your SEO efforts. Conversely, if branded search volume drops due to external market factors, it can mask the steady growth of your non-branded, informational content.
To build this into your template, you need to utilize Regular Expressions (RegEx) within Google Search Console or Looker Studio. Create two distinct data views:
- Branded View: Use a RegEx filter to include queries containing your brand name and common misspellings (e.g.,
.*brandname.*|.*brand name.*|.*brndname.*). This tracks brand equity and navigational intent. - Non-Branded View: Use a RegEx filter to exclude those same brand terms. This reveals your "true SEO" growth—how well you are capturing new audiences who are searching for solutions, not specifically for your company.
By presenting these two metrics side-by-side, your analysis provides a much clearer picture of where growth is actually originating.
How to Build a Cross-Tool Workflow Using Google Sheets and Ahrefs
No single SaaS tool provides a perfect, out-of-the-box analysis. Automated dashboards are excellent for monitoring, but deep analysis requires manipulating raw data. A highly recommended approach is building a "Master Audit Sheet" that merges backlink data from Ahrefs with user behavior data from Google Search Console.
Here is how to structure this cross-tool workflow in your spreadsheet template:
- Export Ahrefs Data: Run a "Top Pages" report in Ahrefs and export it as a CSV. This provides data on URL Rating (UR), total referring domains, and estimated organic traffic per page.
- Export GSC Data: Navigate to Google Search Console, select the "Pages" tab under Performance, and export the last 3 months of data (Clicks, Impressions, CTR, Position).
- Normalize the URLs: Ensure both datasets format URLs identically (e.g., both include or exclude the trailing slash). This is critical for the next step.
- Merge with VLOOKUP/XLOOKUP: In your Master Sheet, use the URL as your unique identifier. Use the
=XLOOKUP()formula to pull the GSC Clicks and Impressions into the Ahrefs data rows. - Add the "Human Insight" Column: This is where reporting becomes analysis. Add a blank column titled "Diagnosis/Next Steps."
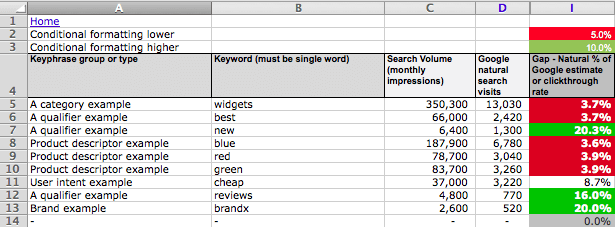
Image source: Smart Insights
Once merged, you can easily filter the data to find high-opportunity pages. For example, you can filter for pages that have high referring domains (strong authority) but low GSC clicks and a poor CTR. The "Human Insight" column might note: "Strong backlink profile, but title tag is unoptimized. Rewrite title to improve CTR."
Common Technical Pitfalls Your Template Might Be Missing
Technical SEO audits often rely on automated crawlers that assign a generic "Health Score." However, these scores frequently miss nuanced rendering issues that plague modern web applications. Your analysis template should include specific checks for these common pitfalls.
The JavaScript Rendering Gap
Modern websites built on frameworks like React, Angular, or platforms like Bubble.io rely heavily on client-side JavaScript. A standard crawler might report that a page is perfectly healthy, but Googlebot may struggle to render the content if the JavaScript execution times out.
Insights from developer communities, such as the Bubble.io forum, highlight that using JS-handled "Button" elements for navigation instead of standard HTML <a href> tags can completely hide internal links from search engines. Your template should include a manual check: "Are primary navigation links visible when JavaScript is disabled?"
Sitemap vs. Indexation Discrepancies
A common point of confusion for clients is seeing pages listed in their XML sitemap but marked as "Discovered - currently not indexed" in GSC. Your template should track the ratio of submitted pages to indexed pages. If this ratio drops, it indicates a crawl budget issue or a perceived lack of content quality by Google, requiring immediate strategic intervention rather than just a technical fix.
According to Google Search Central's technical fundamentals, you should never use the robots.txt file to remove a page from search results. If a page is blocked by robots.txt, Google cannot crawl it to see a noindex tag, meaning the URL might still appear in search results if linked externally. Always use the noindex meta tag for removal.
Soft 404s vs. True 404s
Many templates group all "Not Found" errors into a single bucket. However, a True 404 (a page that returns a 404 HTTP status code) is a natural part of the web. A Soft 404 (a page that says "Not Found" but returns a 200 OK status code) is highly detrimental to your crawl efficiency. Your analysis must separate these, prioritizing the resolution of Soft 404s to preserve crawl budget.
How to Prioritize Your SEO Action Plan
Data analysis is only valuable if it leads to prioritized action. Presenting a client with a list of 50 technical errors and 20 content gaps is overwhelming. A professional template includes a prioritization framework to guide the "Next Steps" discussion.
We recommend incorporating a Priority vs. Effort Matrix into the final section of your analysis document. This helps stakeholders understand why certain tasks are scheduled for this month while others are pushed to the next quarter.
| Category | Effort Level | Impact Level | Examples for the Template |
|---|---|---|---|
| Quick Wins | Low | High | Updating title tags on pages ranking #11-15; fixing broken internal links; adding internal links from high-authority pages to new content. |
| Major Projects | High | High | Restructuring site architecture; migrating to a new CMS; developing comprehensive core content hubs. |
| Fill-ins | Low | Low | Compressing minor images; fixing isolated spelling errors; updating meta descriptions on low-traffic pages. |
| Time Sinks | High | Low | Chasing toxic link disavows without manual penalty notices; over-optimizing pages that already rank #1. |
By categorizing your findings into this matrix, you transition from being a data reporter to a strategic advisor. Clients are much more likely to approve retainers when they clearly see the ROI potential of "Quick Wins" versus the long-term necessity of "Major Projects."
Should You Use Live Dashboards or Static Slide Decks?
A frequent debate in the SEO community is the format of the analysis itself. SaaS providers often push for live, interactive dashboards, while veteran consultants frequently prefer static slide decks or PDFs. Both have distinct advantages, and the choice depends heavily on your client's sophistication.
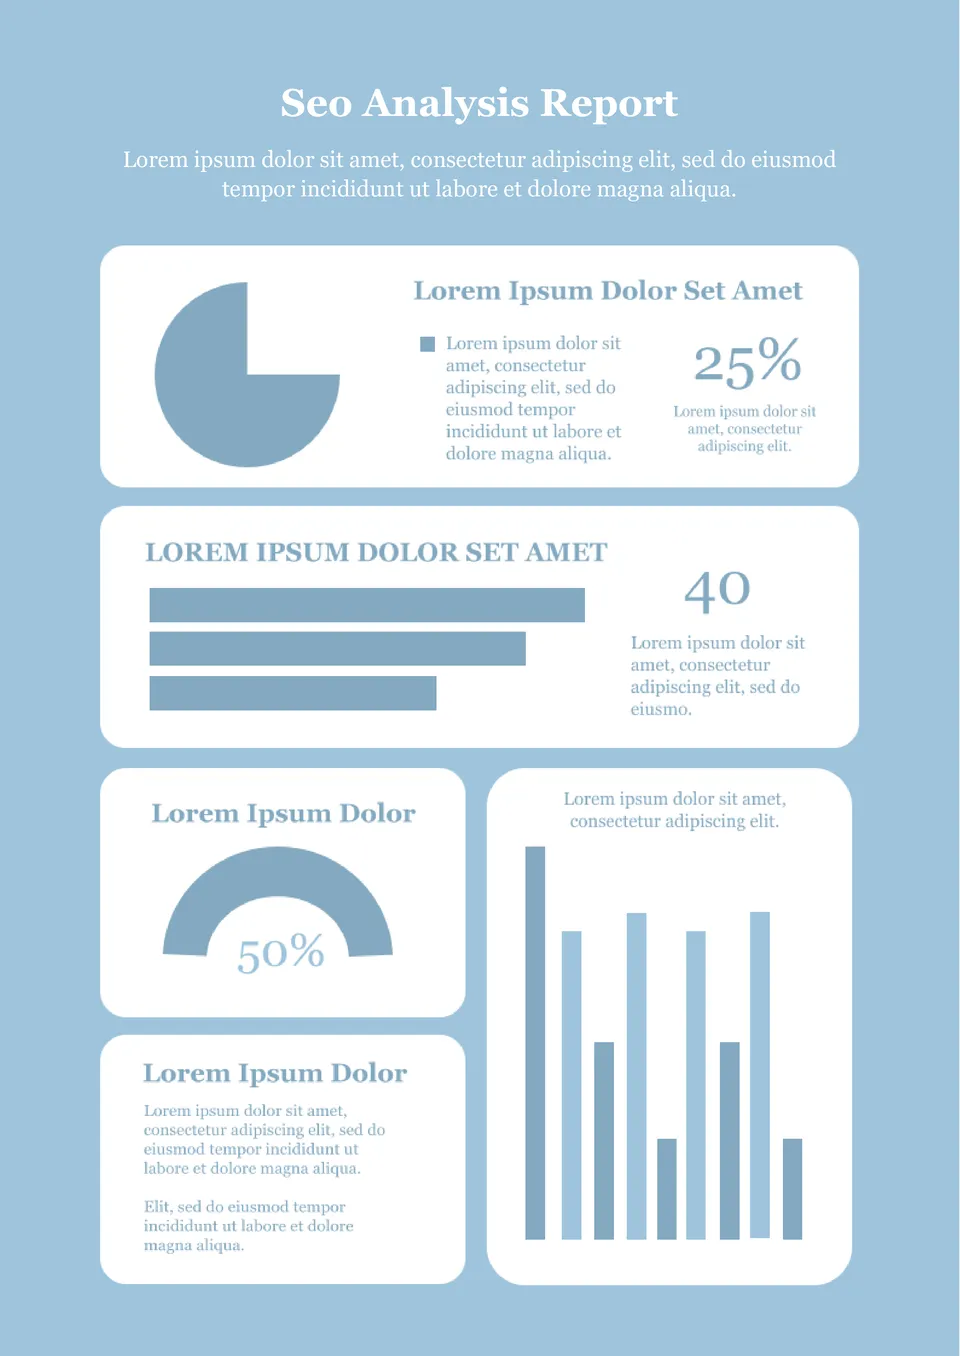
Image source: Docsandslides.com
The Case for Live Dashboards
Live dashboards (built in Looker Studio, Tableau, or proprietary agency software) offer unparalleled transparency. Clients can log in at any time, adjust date ranges, and see real-time performance. This format is highly efficient for the agency, as it eliminates the need to manually compile data each month. It is an excellent choice for highly technical clients who want to explore the data themselves.
The Case for Slide Decks
Static slide decks excel at storytelling. When you send a live dashboard, the client might focus on a minor drop in a vanity metric and panic. A slide deck allows you to control the narrative. You can present the data, immediately follow it with your analysis of why it happened, and conclude with your strategic recommendation. This format is widely regarded as the most effective way to present to C-suite executives who only have 10 minutes to review the findings.
The Hybrid Recommendation
For a robust 2026 workflow, a hybrid approach ranks among the top strategies. Use automated live dashboards for internal team tracking and for clients who request real-time access. However, for the official monthly or quarterly review, extract the key visualizations from the dashboard and place them into a slide deck, accompanied by written, human-driven analysis.
How to Automate Your Reporting to Save 6 Hours per Month
While the analysis must be human-driven, the reporting (data gathering) should be entirely automated. According to industry data highlighted by Semrush and other platforms, manually compiling data from GA4, GSC, and rank trackers takes an average of 6 to 8 hours per client, per month.
By utilizing automation tools, you can reduce this data-gathering phase to roughly 15 minutes, freeing up your time to focus on the actual strategy.
Tools like Looker Studio offer a free, highly customizable way to blend GA4 and GSC data. For agencies managing dozens of clients, paid platforms like Whatagraph or Swydo provide pre-built API connectors that pull in data from Ahrefs, Semrush, and social platforms simultaneously.
The key to successful automation is maintaining the "human touch." Your automated template should include static text boxes where the account manager must manually type in their executive summary and strategic insights before the report is sent. Automation should handle the numbers; humans must handle the narrative.
Frequently Asked Questions
- What is the difference between an SEO audit and an SEO analysis?
- An SEO audit is typically a point-in-time health check that identifies technical errors, broken links, and missing metadata. It is a diagnostic tool. An SEO analysis is an ongoing, strategic interpretation of performance metrics over time, focusing on user behavior, ranking trends, and ROI attribution.
- How often should I present an SEO analysis report to stakeholders?
- Monthly reporting is the industry standard for most campaigns. However, for highly volatile enterprise sites or during a major site migration, weekly check-ins may be necessary. Conversely, high-level executive summaries are often best delivered on a quarterly basis to show broader, long-term trends.
- What are the most important Core Web Vitals to track in 2026?
- As of recent updates, the primary Core Web Vitals to monitor are Largest Contentful Paint (LCP) for loading speed, Cumulative Layout Shift (CLS) for visual stability, and Interaction to Next Paint (INP), which replaced First Input Delay (FID) to better measure overall page responsiveness.
- How do I show SEO ROI if the sales cycle is long?
- For B2B companies with long sales cycles, last-click attribution will severely undervalue SEO. Your template should track "Assisted Conversions" in GA4 to show how often organic search was part of the user's journey. Additionally, establish micro-conversions (like whitepaper downloads or newsletter signups) and assign them a baseline monetary value.
- Can I create a professional SEO report using only free tools?
- Yes. A highly effective and professional analysis can be built entirely using free tools. By connecting Google Analytics 4 and Google Search Console to Looker Studio, you can create dynamic, comprehensive dashboards. The only limitation will be the lack of competitor backlink data, which typically requires a paid third-party tool.
Final Thoughts on SEO Analysis
Transitioning from basic reporting to strategic analysis is what separates average marketers from indispensable growth partners. By implementing a structured template that forces you to look beyond surface-level metrics, you can clearly demonstrate the business value of your organic search campaigns.
- Focus on the "Why": Always pair data visualizations with human-written insights explaining the root cause of metric fluctuations.
- Segment Your Traffic: Isolate branded search queries from non-branded queries to reveal the true impact of your content strategy.
- Adapt to AI: Incorporate tracking for AI Overviews and Position Zero features, as traditional blue-link tracking is no longer comprehensive.
- Prioritize Action: Use a Priority vs. Effort matrix to ensure stakeholders know exactly which tasks will yield the highest return on investment.
- Automate the Data: Leverage tools like Looker Studio to automate data gathering, reserving your billable hours for strategic thinking.
Start by exporting your current GSC and backlink data into a master spreadsheet today to identify your first high-impact, low-effort optimization opportunity.